Checking the application status
The first step is to verify the status of your application. Open the Magic Containers Dashboard and go to the Overview tab. In the top-right corner, you will find the global application status. If your application is experiencing issues, this status will remain in a “Processing” state.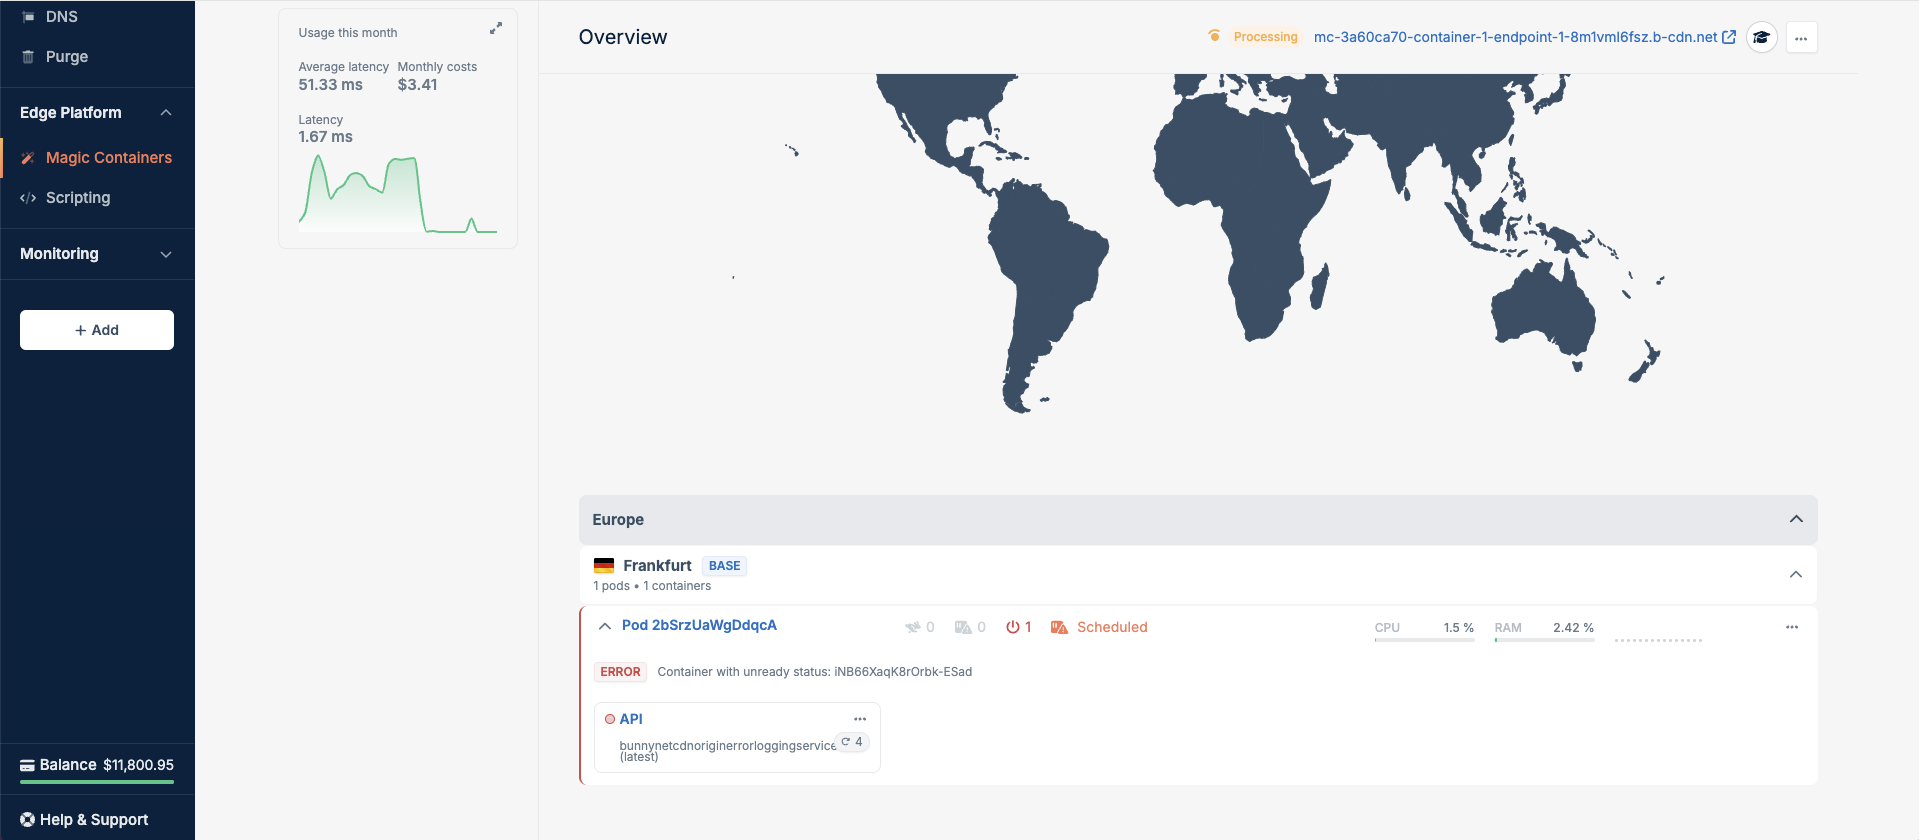
Checking region and pod status
If the global application status shows “Processing” or indicates an error, select the specific region you suspect is having issues. This will navigate you to the region details page, where you can view the status of all pods deployed in that region. Look for any pods flagged as “Error” or showing other failure indicators. Selecting the problematic pod will open a side panel where you can view further details, including live logs and error messages. Pods that cannot start or fail health checks are usually labeled with an error message clarifying the reason. Inspect these messages to determine whether the issue is related to the container image, network configuration, environment variables, or a failing health probe. The side panel also provides a live log stream to help identify application-level exceptions as they occur. Note that historical logs are not yet available, so you must monitor logs in real time to capture relevant information. To get more details, select the affected region to check details about the pod(s) running in that region. You can do this by clicking on the troublesome region. The view will navigate to the region details and display the status of all pods deployed in that region. Pods with issues will have an error indicating the cause. For further details, click on the pod to open the side panel, where you can view additional information, including detailed logs.At this time, we only support live streaming of logs. Historical log access is not yet available.