Health check types
Magic Containers offers three types of health checks:- Startup - Verifies the application has successfully started. No requests are routed until this check passes.
- Readiness - Ensures the application is ready to handle incoming requests. We strongly recommend enabling this check to avoid failed requests.
- Liveness - Confirms the application is actively running without problems.
Configuration
Open container settings
Navigate to Magic Containers, select your app, click Container Settings, then Edit.
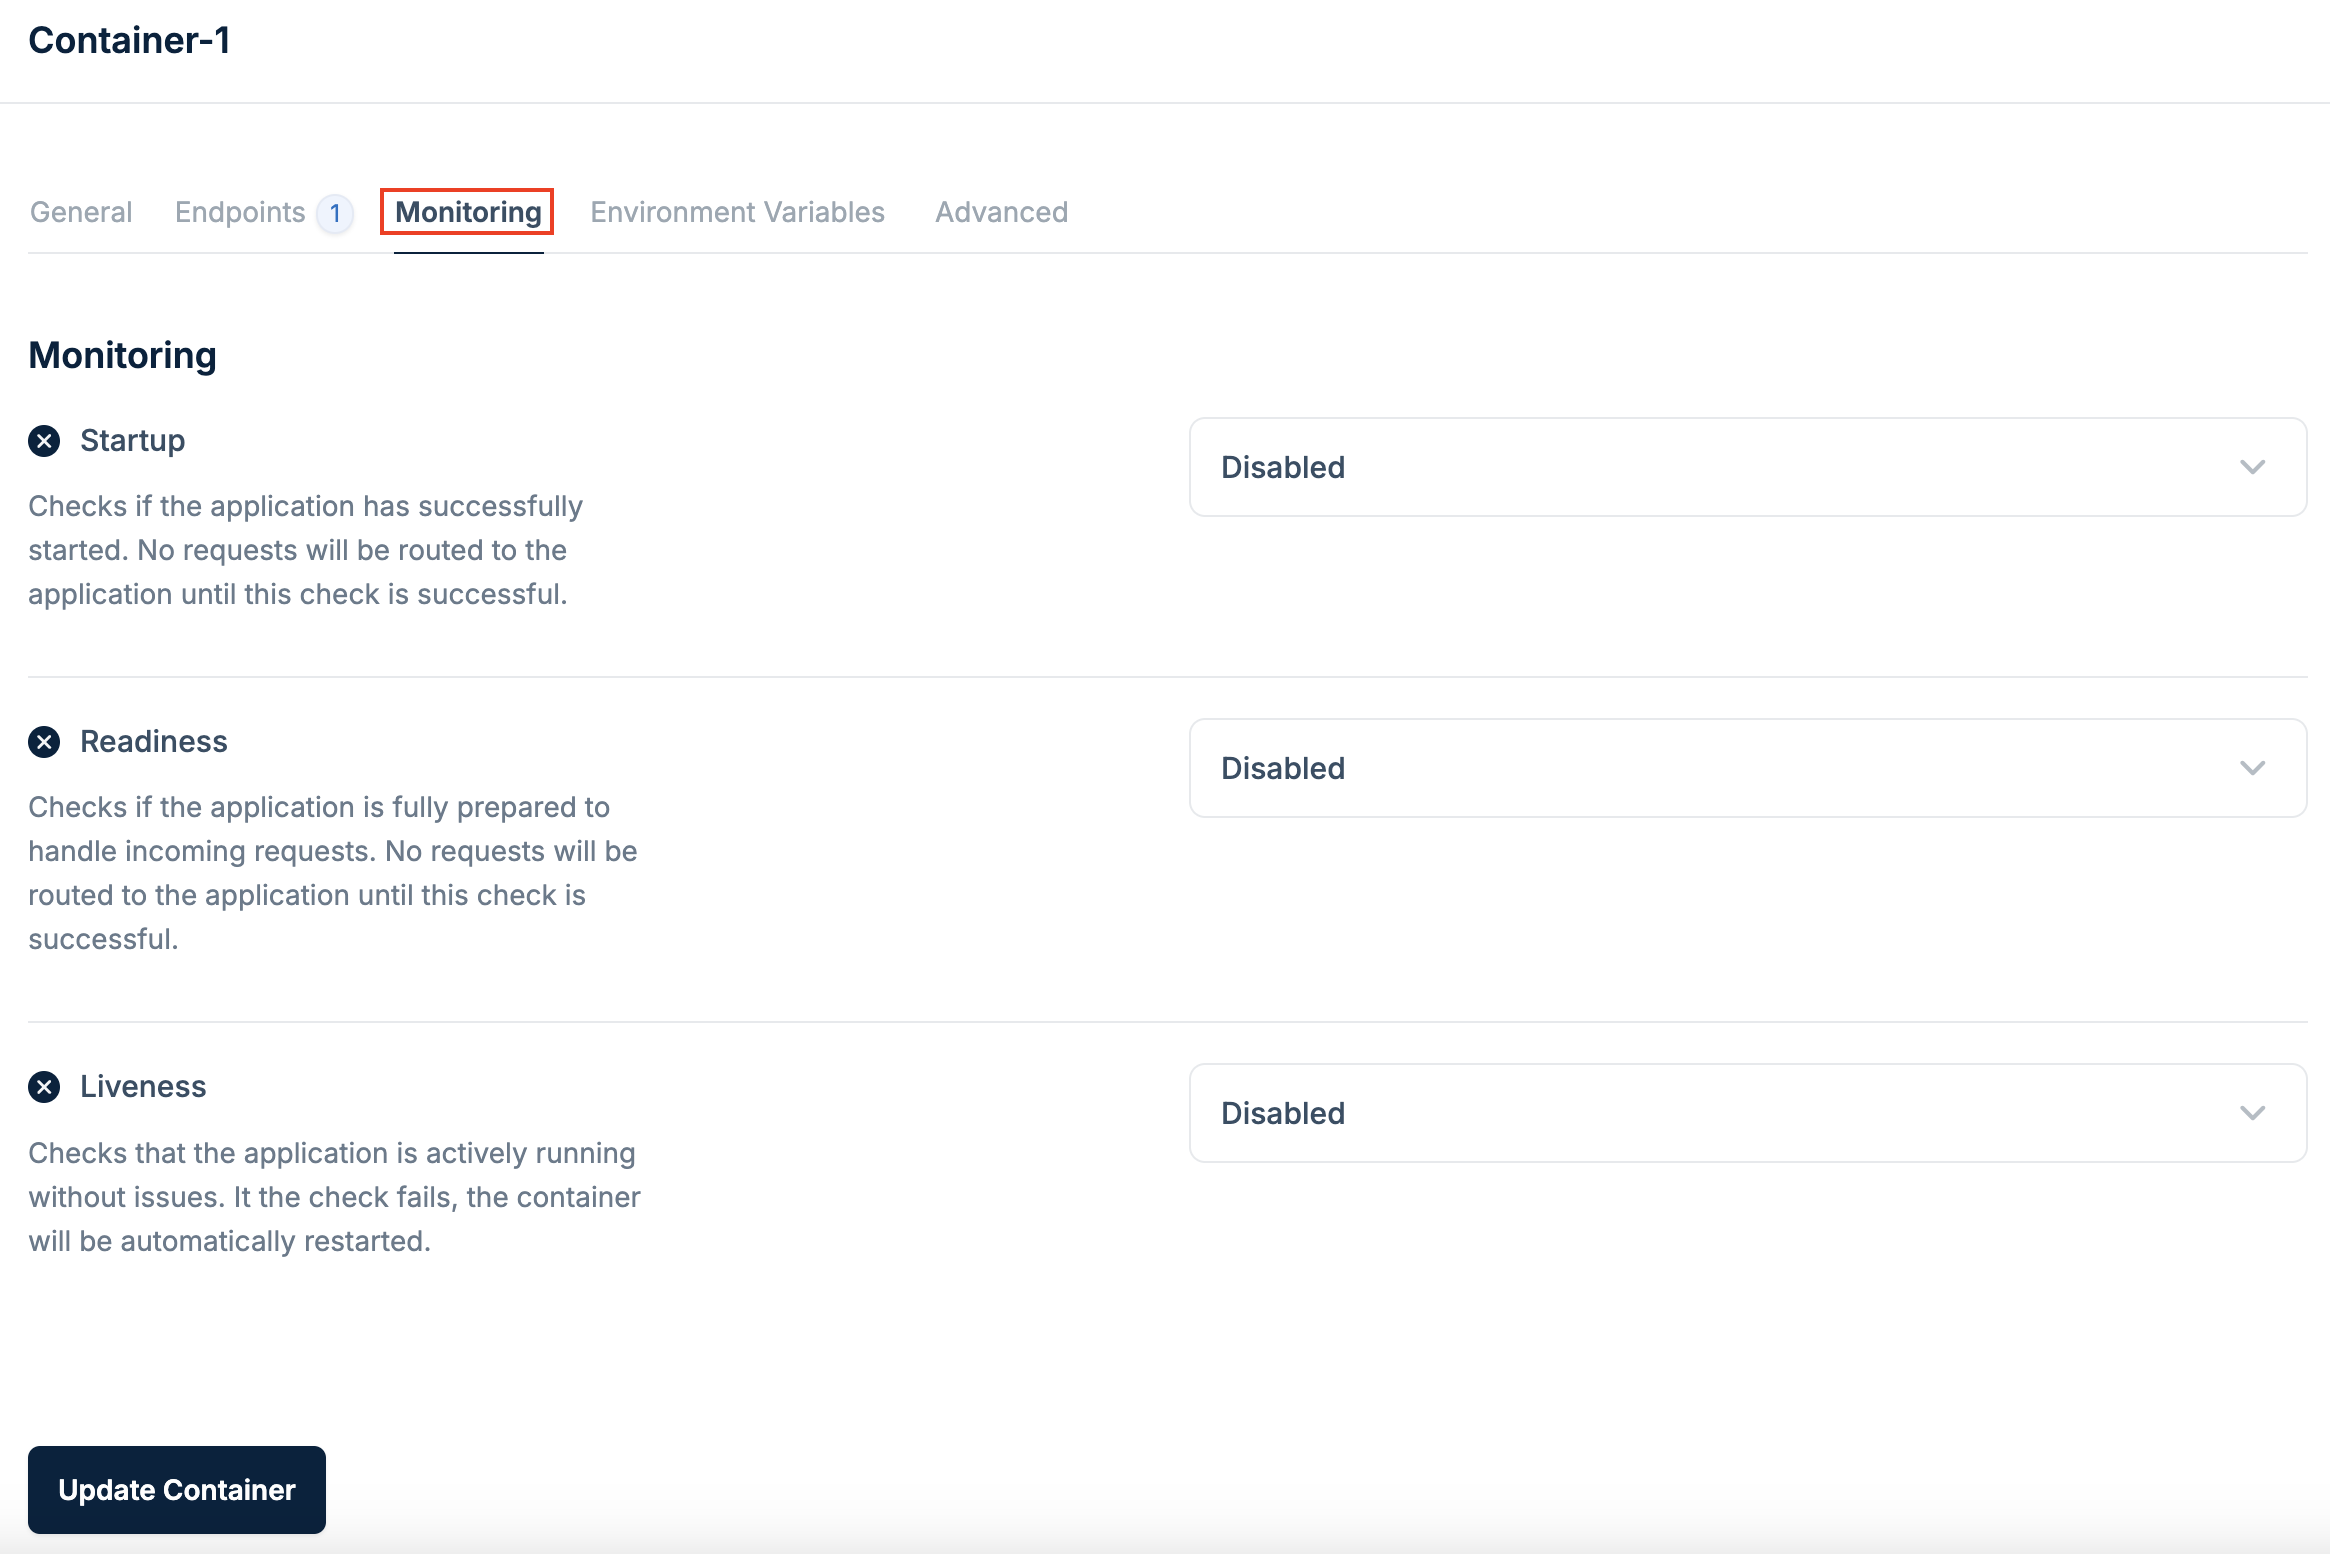
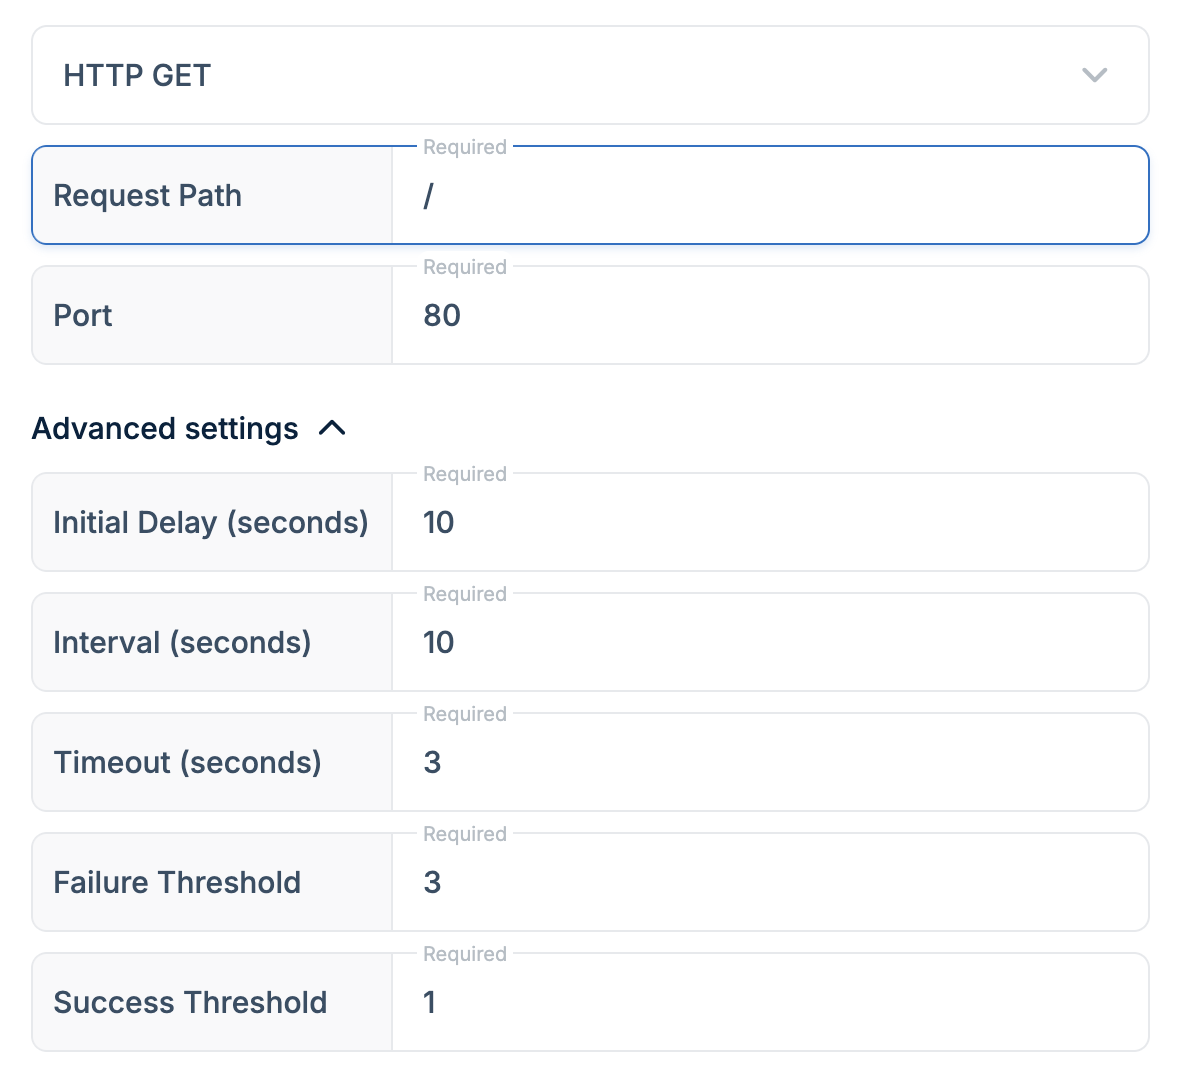
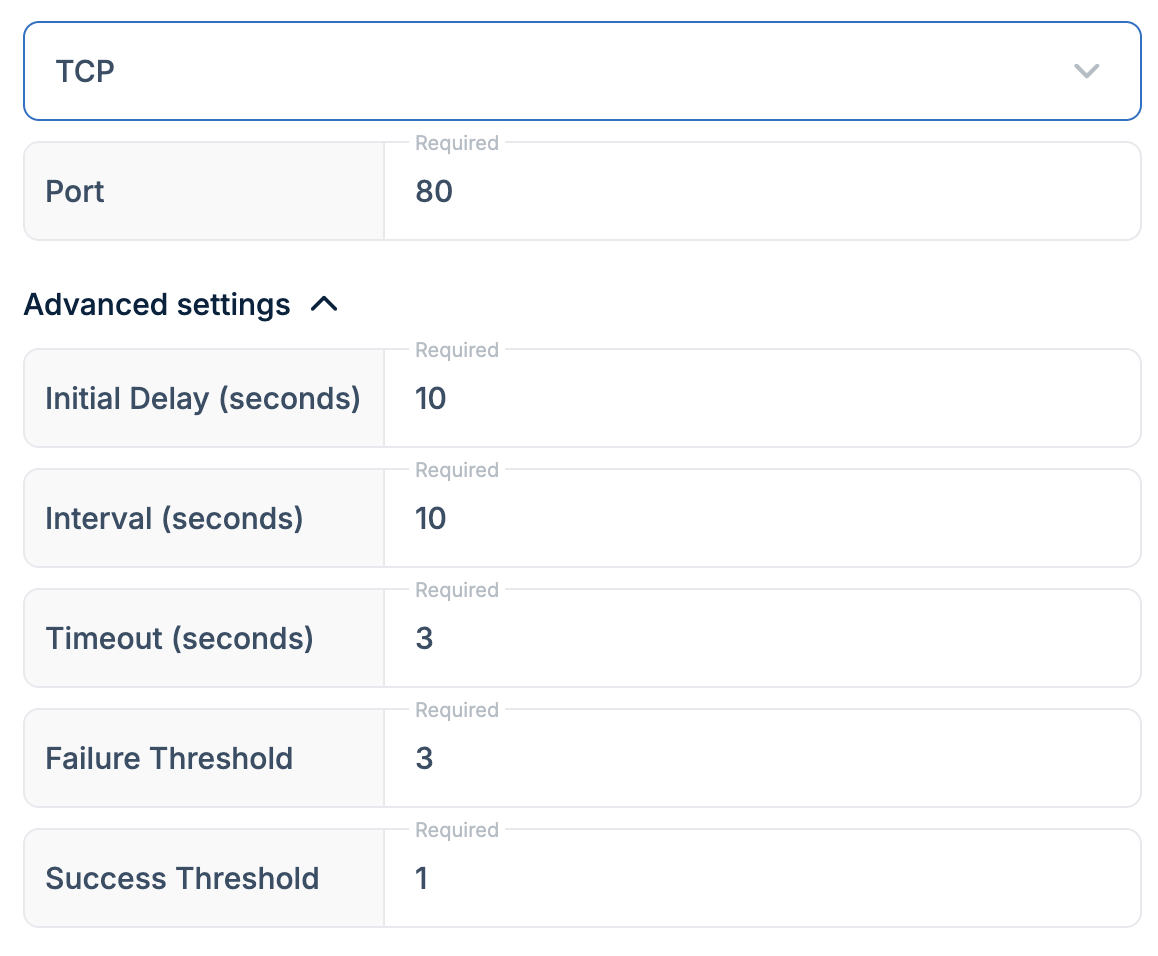
Enable health checks
Click the checkbox for each health check type you want to enable (Startup, Readiness, Liveness).
We strongly recommend enabling at least the Readiness health check to minimize failed requests and ensure a smoother user experience.