What you’ll need
Before you dive in, make sure you have the following prerequisites in place:- A bunny.net account (Log in or sign up for a free trial).
- Ensure that you have already deployed the application you want to monitor.
Accessing app monitoring
To access the App Monitoring feature, follow the steps below:- Login to bunny.net dashboard.
- Navigate to the Magic Containers section and select the app you want to monitor.
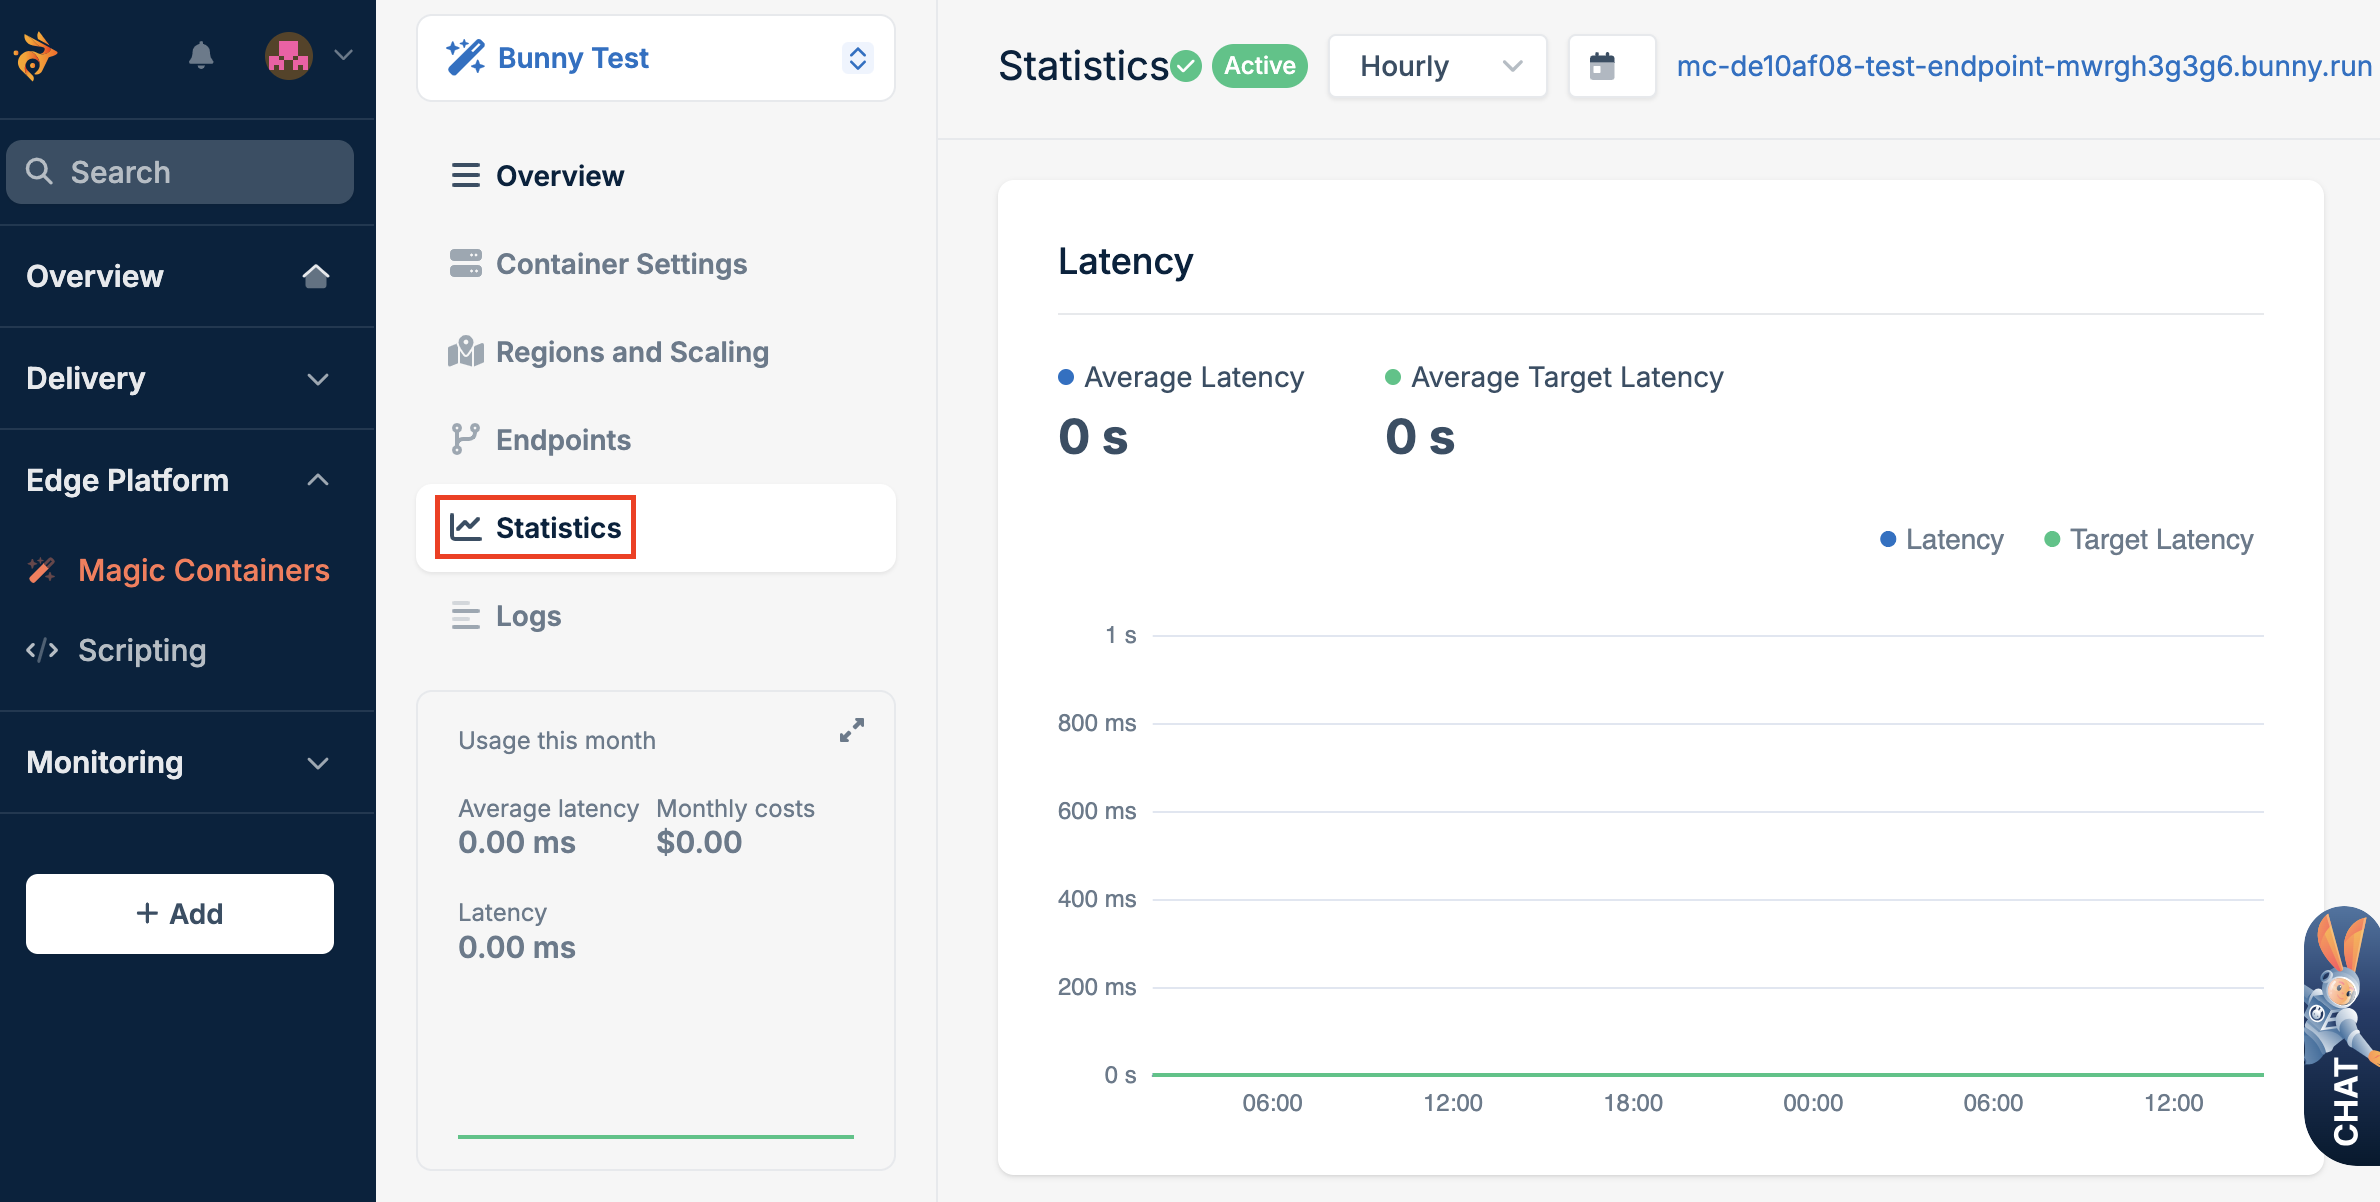
- Once you’ve selected your app, click the Statistics tab to access detailed insights into its performance.
Available metrics
The Statistics tab provides a range of metrics that give you a comprehensive view of your application’s behavior. Here are the key metrics available:- Latency: Latency measures the time it takes for a request to travel from the source to the destination and receive a response. In the context of Magic Containers, it indicates the responsiveness of your application.
- Instances and active regions: This metric provides insights into the number of instances running your application and the active regions where these instances are distributed.
- Traffic served: This measures the amount of data served by your application, providing insights into its overall usage.
- CPU usage: The central processing unit (CPU) monitors your application’s usage, helping you understand the computational load.
- Memory usage: Tracks the memory consumption of your application, highlighting its memory usage patterns.
Configuring display options
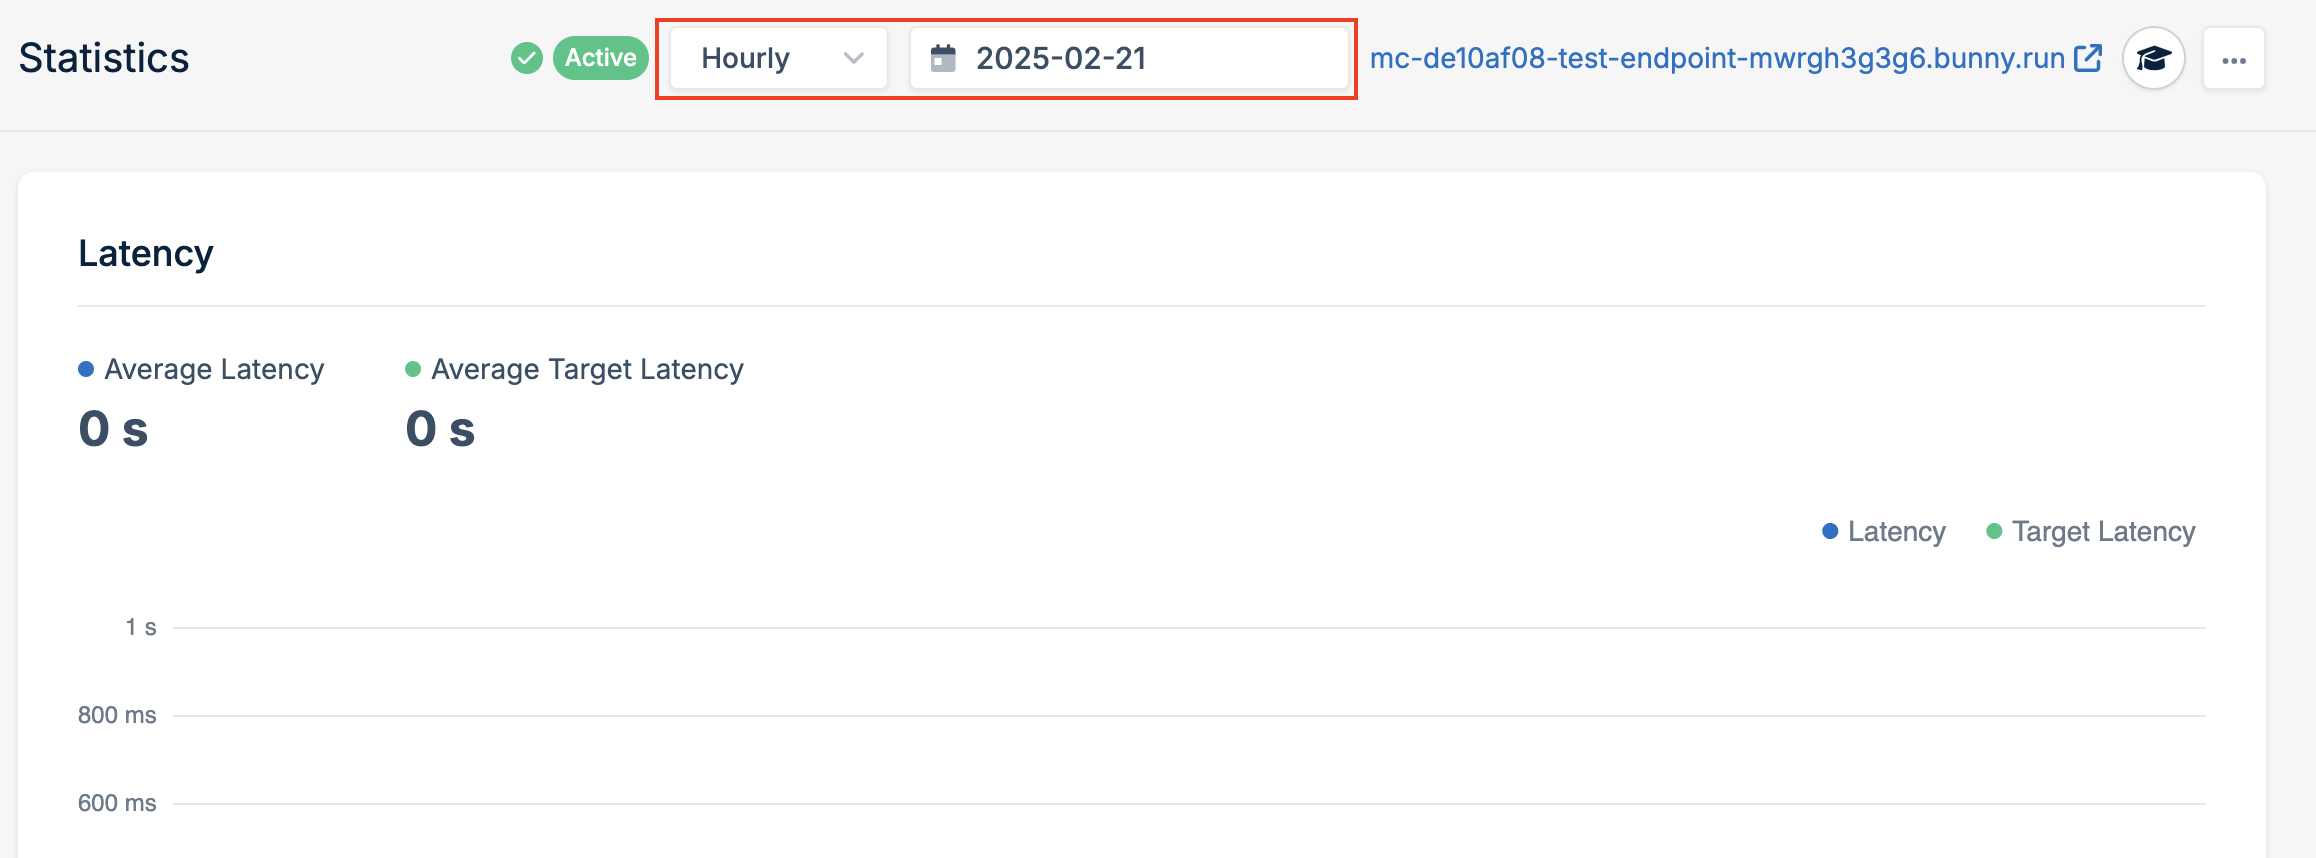
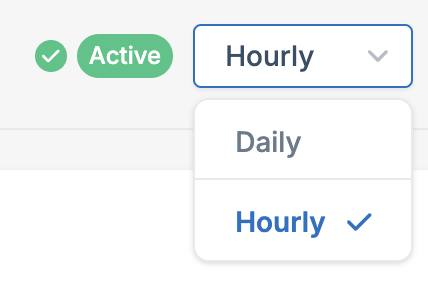
Time Period
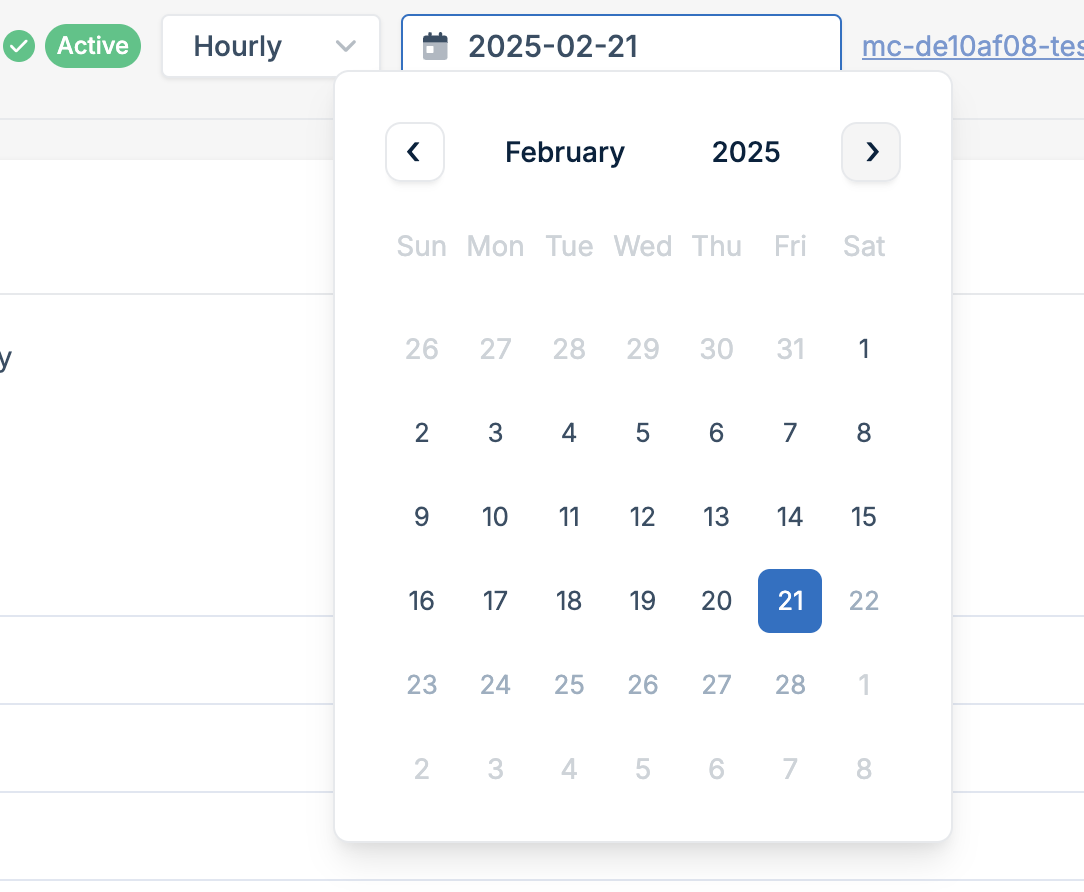
Date Selection