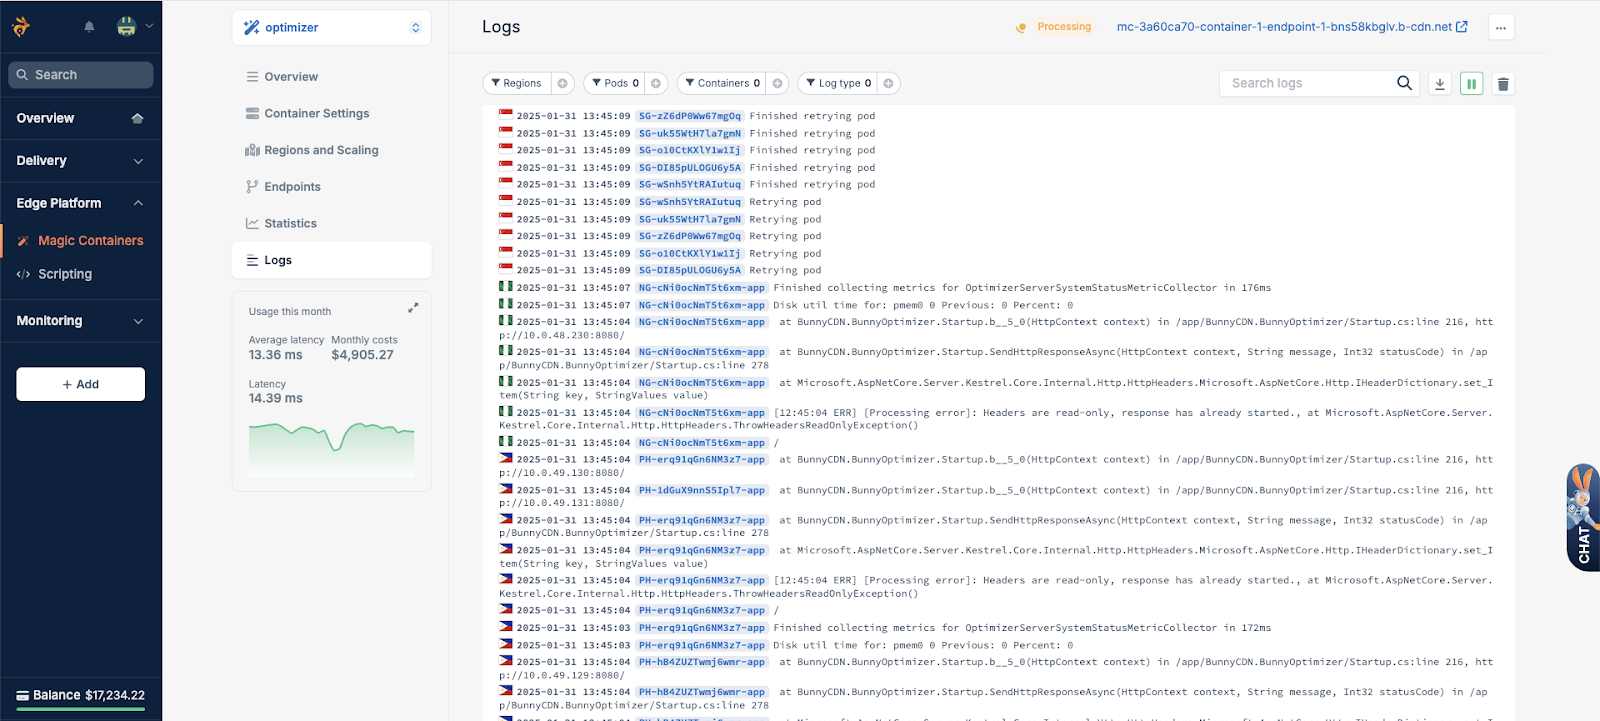
This single interface provides both platform-level (system) logs and application-level (app) logs. System logs reveal the internal events and decisions made by the Magic Containers infrastructure, such as successful or failed container starts, networking issues, or health check responses. App logs consist of the standard output and error streams from the containers themselves, showing any messages your software generates.
Because logs are live-streamed, you can only view them in real time. The platform currently does not retain historical logs, so troubleshooting is most effective when you keep the log view open while reproducing the problem in your application. To quickly pinpoint issues, you can narrow your scope by focusing on a specific region, pod, or container within the pod. You can also switch between system logs and app logs to determine whether a malfunction originates in the platform’s orchestration layer or your application code.
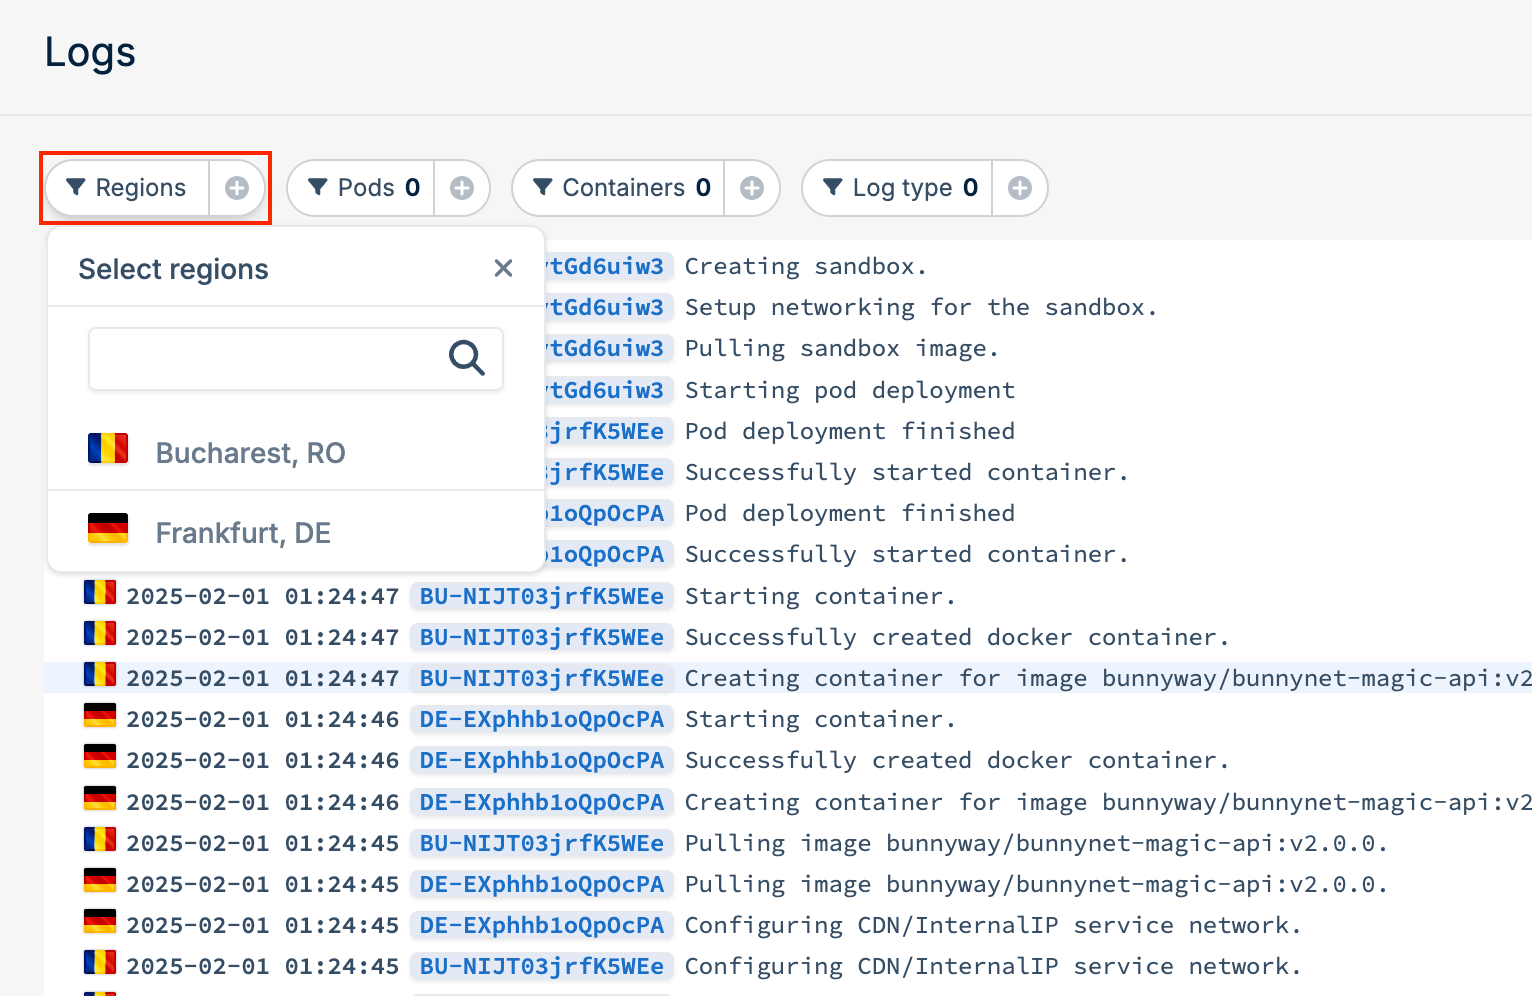
Filtering logs
Filtering logs by application or region is also helpful if you manage many deployments across different environments.
Narrowing down the view to a single location can highlight specific regional issues, like network latency or hardware constraints. If the entire application experiences recurring difficulties, switching to a broader application-level view will reveal whether the problem occurs in multiple pods and regions simultaneously. Last modified on November 26, 2025