What you’ll need
Before you dive in, make sure you have the following prerequisites in place:
- A bunny.net account (Log in or sign up for a free trial).
- Ensure that you have already deployed the application you want to monitor.
Accessing app monitoring
To access the App Monitoring feature, follow the steps below:
-
Login to bunny.net dashboard.
-
Navigate to the Magic Containers section and select the app you want to monitor.
-
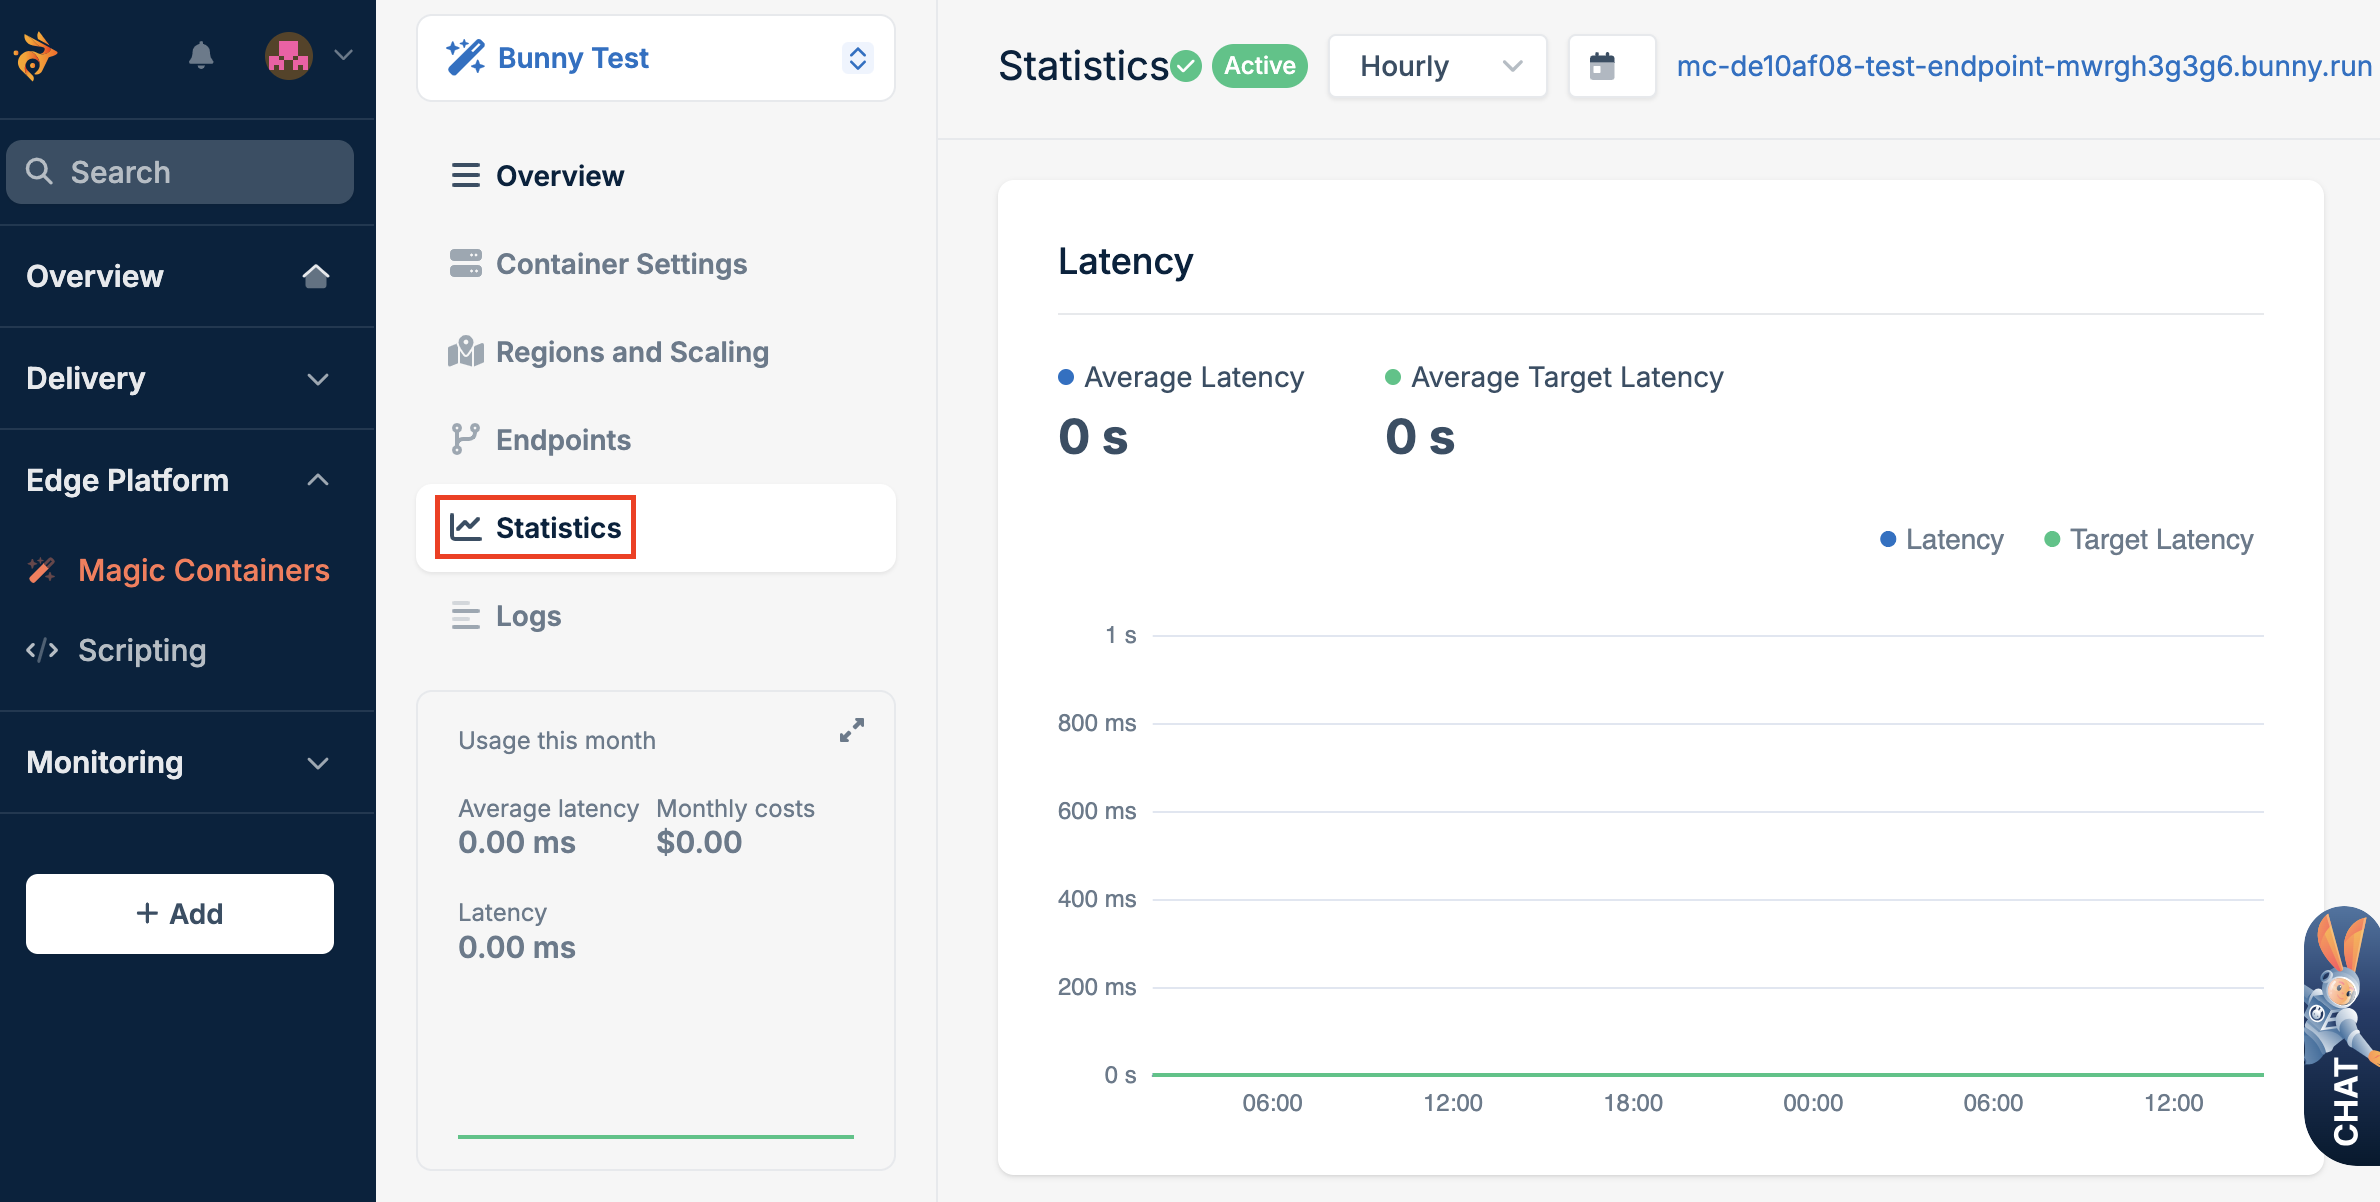
Once you’ve selected your app, click the Statistics tab to access detailed insights into its performance.
Available metrics
The Statistics tab provides a range of metrics that give you a comprehensive view of your application’s behavior. Here are the key metrics available:
- Latency: Latency measures the time it takes for a request to travel from the source to the destination and receive a response. In the context of Magic Containers, it indicates the responsiveness of your application.
- Instances and active regions: This metric provides insights into the number of instances running your application and the active regions where these instances are distributed.
- Traffic served: This measures the amount of data served by your application, providing insights into its overall usage.
- CPU usage: The central processing unit (CPU) monitors your application’s usage, helping you understand the computational load.
- Memory usage: Tracks the memory consumption of your application, highlighting its memory usage patterns.
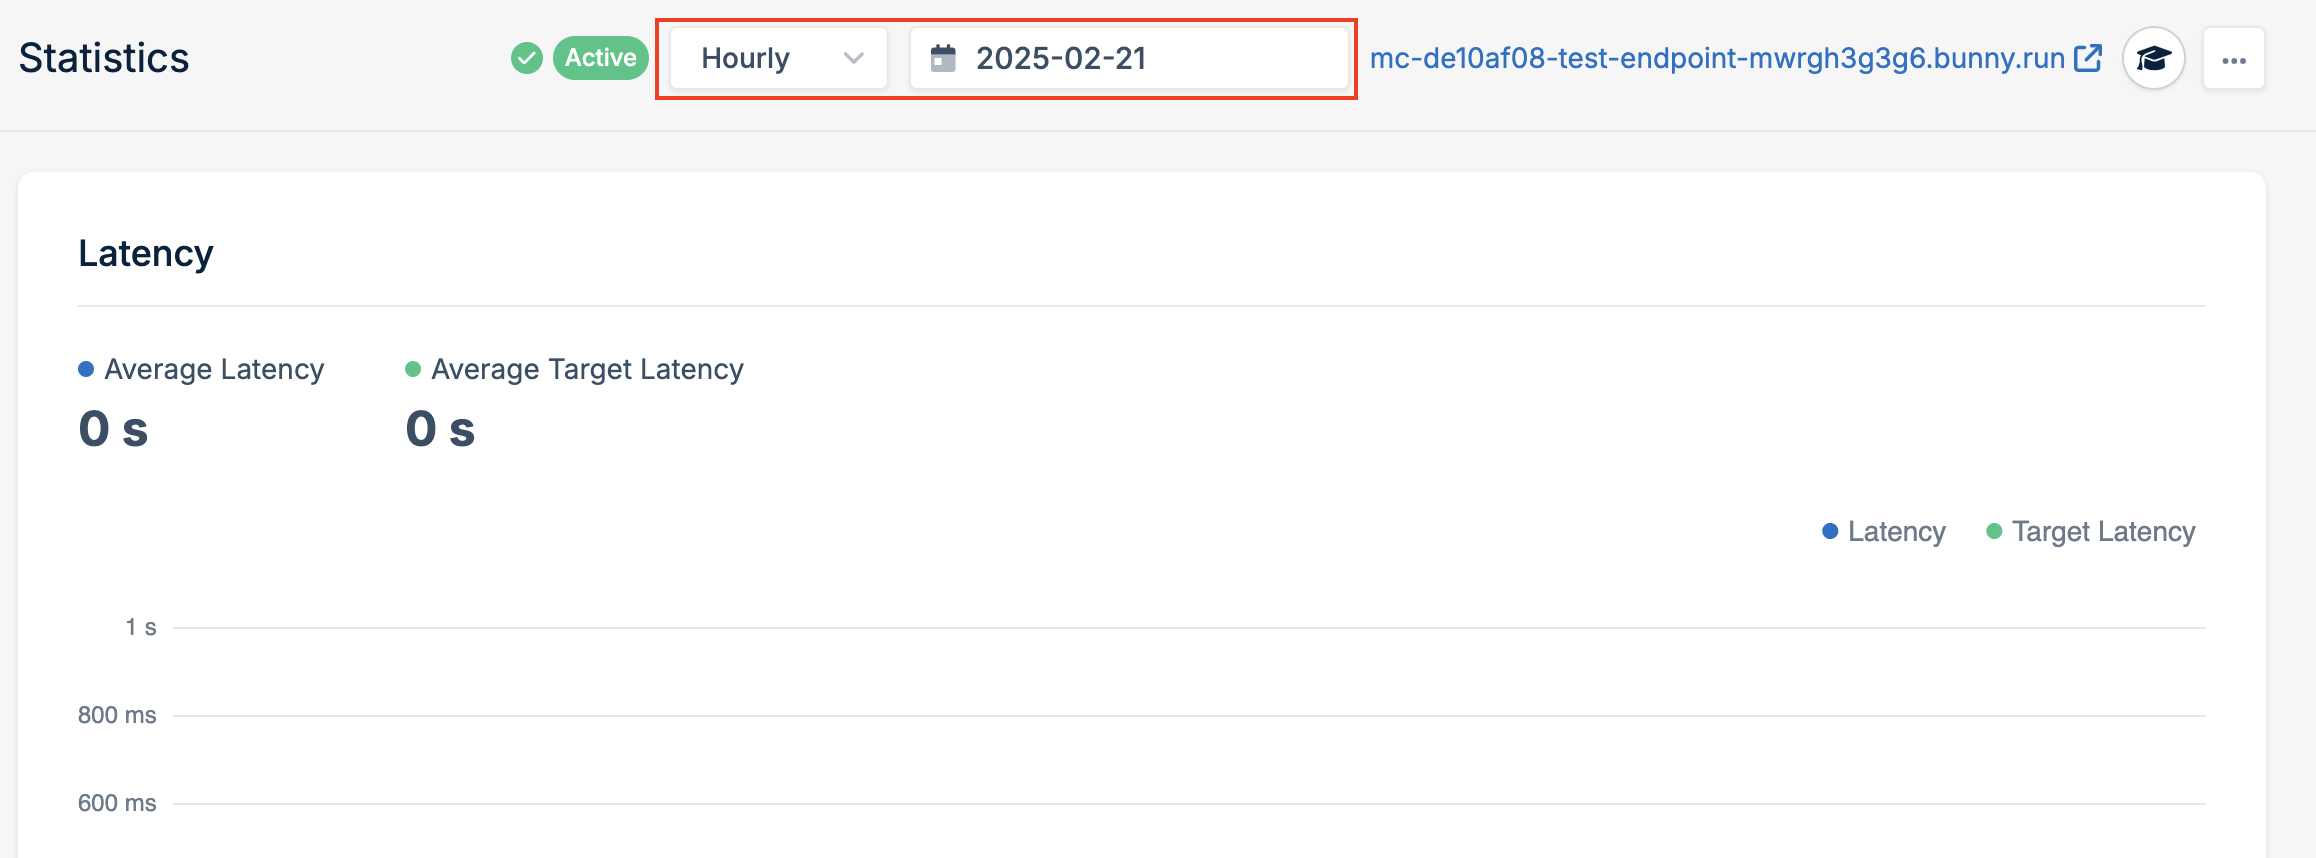
Configuring display options
Effectively utilizing Magic Containers’ monitoring tools involves tailoring the display to meet your specific analysis needs. Customize the display options to focus on the metrics and timeframes that matter most to you.
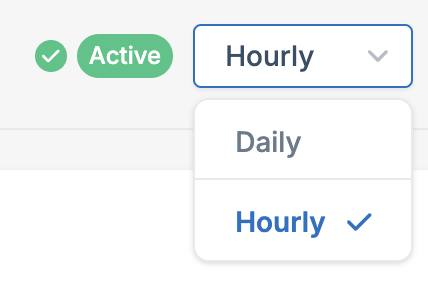
Time Period
You can toggle between daily and hourly statistics to analyze trends over different timeframes. This flexibility helps you identify patterns and trends in your application’s behavior.
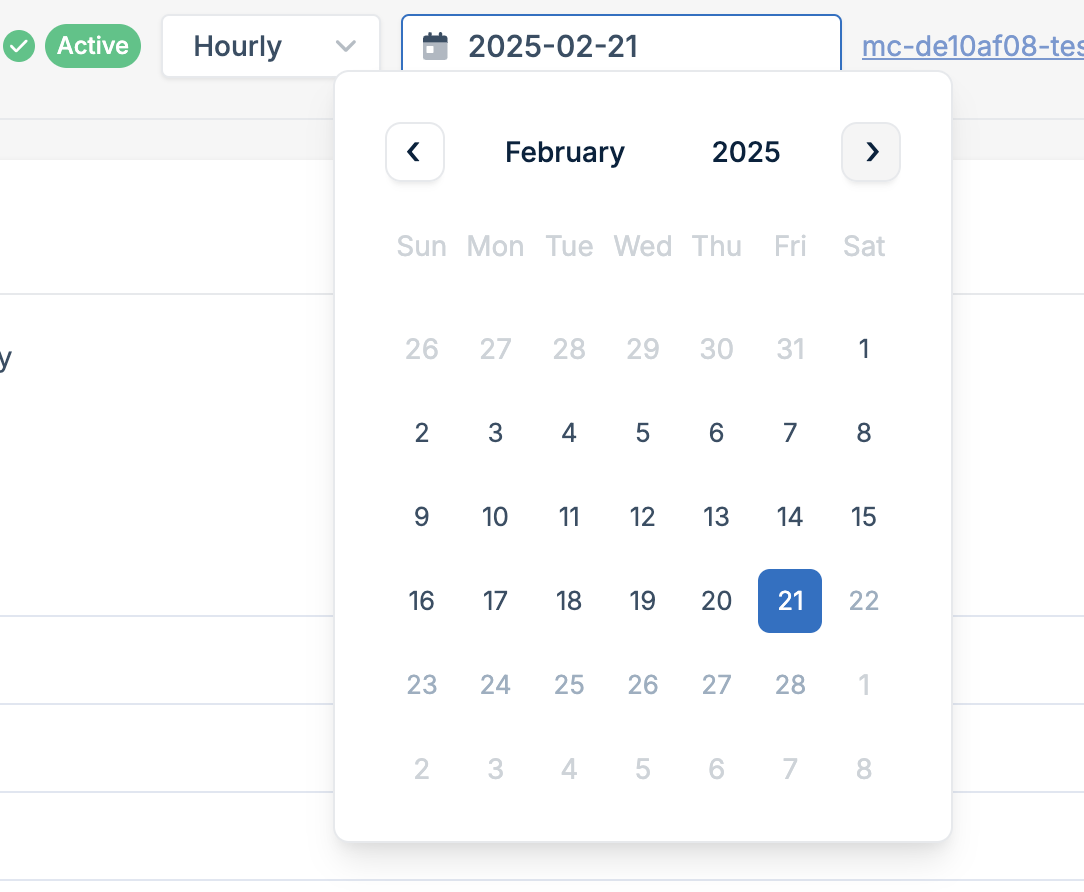
Date Selection
Select a specific date to focus on particular periods, facilitating a detailed analysis of your application’s historical performance.Last modified on November 26, 2025